What we offer
Natural hazard and risk assessment
Spatially explicit, evidence-based risk intelligence for flood, landslide, cloudburst, and drought — enabling risk-informed decisions on where to build, where to invest, and where to reduce exposure before disasters occur.
Service overview
Across India’s rapidly urbanising landscapes, critical investment decisions — new townships, road corridors, drainage upgrades, and housing projects — are routinely made without verified knowledge of flood, landslide, or drought exposure. Risk assessments, where they exist, are often outdated, non-spatial, or insufficiently granular to condition individual site decisions. The result is infrastructure built into harm’s way, scheme funds allocated without risk context, and preparedness plans built on incomplete data.
For hill states like Uttarakhand, this is an acute and documented problem. Recent floods and landslides have caused significant loss of life and infrastructure damage in areas where spatial risk intelligence could have guided safer development.
Anora Intel provides multi-hazard risk assessments that move from susceptibility and vulnerability mapping through to integrated risk output — structured to the scale, hazard type, and decision context of each engagement.
Service modules
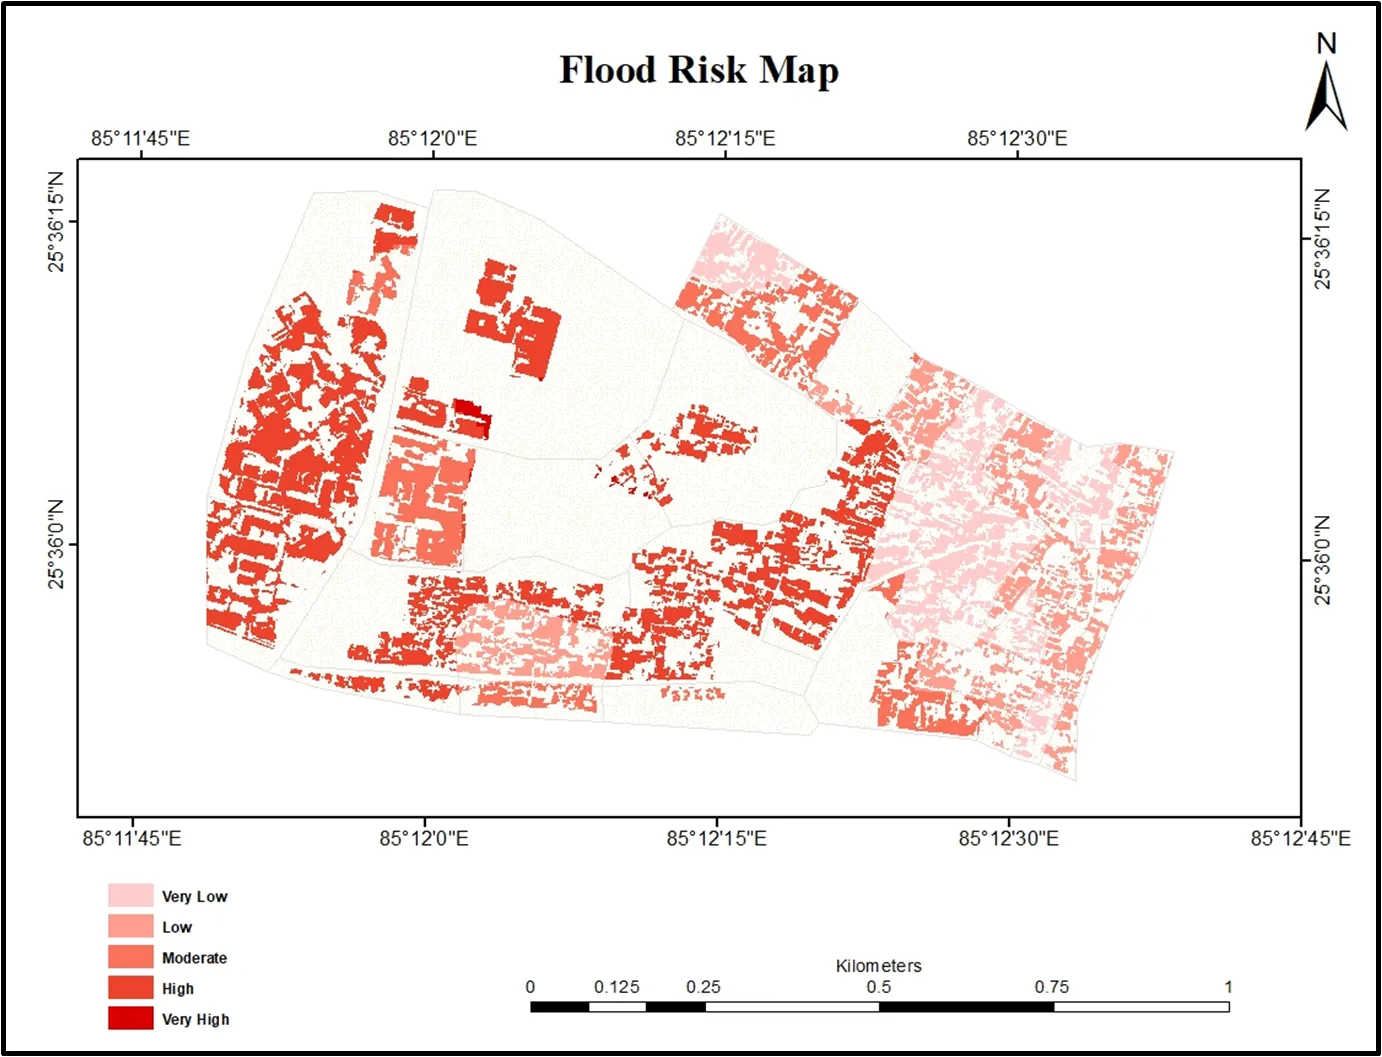
Flood risk assessment
Rainfall-induced inundation modelling integrating DEM, river level data, reservoir storage, rainfall, drainage networks, road network, and census data. Outputs range from a flood risk zone map to a comprehensive flood model report with river levels and reservoir storage. Reference timeline: 4 months for a basic risk map; 6–7 months for a comprehensive report at the scale of Dehradun.
Landslide susceptibility mapping
Infrastructure route planningSlope, geology, land cover, soil moisture, historical event locations, rainfall, vegetation, and hydrological soil group combined into susceptibility, vulnerability, and hazard layers. Particularly critical for hill state satellite town siting. Typically delivered alongside flood risk assessment.
Cloudburst risk mapping
Historical cloudburst event inventory with spatial data and vulnerability assessment, generating risk zone maps with gradient scoring. Near-real-time alert system in development, dependent on meteorological inputs.
Drought monitoring
Three drought typologies covered: meteorological drought (SPI derived from IMD and ERA5 reanalysis), agricultural drought (NDVI, EVI, SMAP, MODIS), and ecological drought (LST, fire indices). Annual update cadence.
How we work
Risk assessment at Anora Intel follows a three-layer framework: susceptibility (where is the physical environment prone to hazard), vulnerability (what is exposed and how sensitive is it), and hazard modelling (what does an event look like given rainfall, terrain, and drainage). The combination produces a risk output — zone maps with quantified gradients, not simply high, medium, and low.
Satellite data sources include Sentinel-1 SAR, optical imagery, DEM, soil moisture from SMAP, and MODIS for agricultural and ecological drought. Ground data that significantly improves accuracy — drainage maps for flood modelling, soil samples for landslide susceptibility, historical event records for cloudburst mapping — is integrated where available.
Field surveys are conducted for vulnerability mapping and, where high-resolution data is required, for soil sampling. All outputs are standardised to applicable NDMA and MoEFCC guidelines, accompanied by clear methodology, assumptions, and limitations.
Risk maps are designed for periodic update. Broad zone maps update every three years or following significant urbanisation. Comprehensive flood models update annually with new precipitation data.
Applications
Safe development siting
Risk-informed township and infrastructure siting identifies where development can proceed safely — avoiding flood plains, landslide corridors, and ecologically sensitive zones before investment is committed. Urban planning without embedded risk intelligence is a planned disaster.
Master plan zoning and development conditioning
Risk outputs condition individual site decisions — restricting construction in high-risk zones, requiring flood-resilient design in moderate-risk areas, and defining the hazard zones referenced in master plans and building regulations.
Infrastructure investment prioritisation
Quantified exposure data helps authorities direct limited capital to the infrastructure upgrades — drainage, retaining walls, early warning systems — that reduce risk most effectively per rupee invested.
Disaster management planning
Hazard maps, vulnerability assessments, and exposure analyses feed directly into district and state disaster management plans, identifying vulnerable areas, critical infrastructure at risk, and priority areas for preparedness and response.
Environmental clearance and scheme applications
Risk assessments produced by Anora Intel can be integrated into EIA and EMP reports, project justification documents, and scheme applications to demonstrate risk awareness and mitigation measures — standardised to NDMA and MoEFCC guidelines.
Typical outputs
Outputs are delivered as structured, scheme-ready documents designed for planning authorities, disaster management bodies, and infrastructure developers — not remote sensing specialists.
- Multi-hazard risk atlas — combined flood, landslide, and exposure mapping across a defined geography, with gradient zone classification and quantified risk scores
- Flood inundation maps — spatial extent of flood events at defined return periods, with affected building and population counts
- Landslide susceptibility maps — gradient susceptibility classification with underlying indicator layers available for planning use
- Drought monitoring reports — annual summaries of meteorological, agricultural, and ecological drought conditions with trend analysis
- Planning briefs — concise decision-support documents identifying high-risk development zones, recommended conditions, and infrastructure investment priorities
- EIA/EMP-ready documentation — risk assessment outputs structured to NDMA and MoEFCC standards for environmental clearance submissions
This service supports compliance and planning under NDMA guidelines, NAPCC, state disaster management acts, and AMRUT 2.0 master planning requirements. See our scheme alignment →
Engagement model
Risk assessment engagements are scoped to the hazard type, geography, and decision the client needs to support. A single-hazard flood risk map for a mid-size hill city can be delivered in four months. A comprehensive multi-hazard atlas covering flood, landslide, and drought typically takes seven to nine months.
Where existing ground data is available — drainage maps, soil surveys, historical event records — timelines and field survey requirements reduce accordingly. A drainage map significantly improves flood risk accuracy; high-resolution soil data gives a material advantage in landslide susceptibility modelling.
Risk assessment and urban growth scenario modelling are designed to connect. The risk atlas defines the envelope within which safe development is possible; the growth scenarios show how to develop within it. Both services can be scoped independently or as an integrated programme.
Ready to talk about your context?
If your question fits this service or sits alongside it, we can help shape a clear scope and practical outputs.
Get in touch →