
Everything we measure, in one place
Seven services across two audiences. Each runs through the same three levels; what changes between them is the subject, and the standard the answer has to meet.
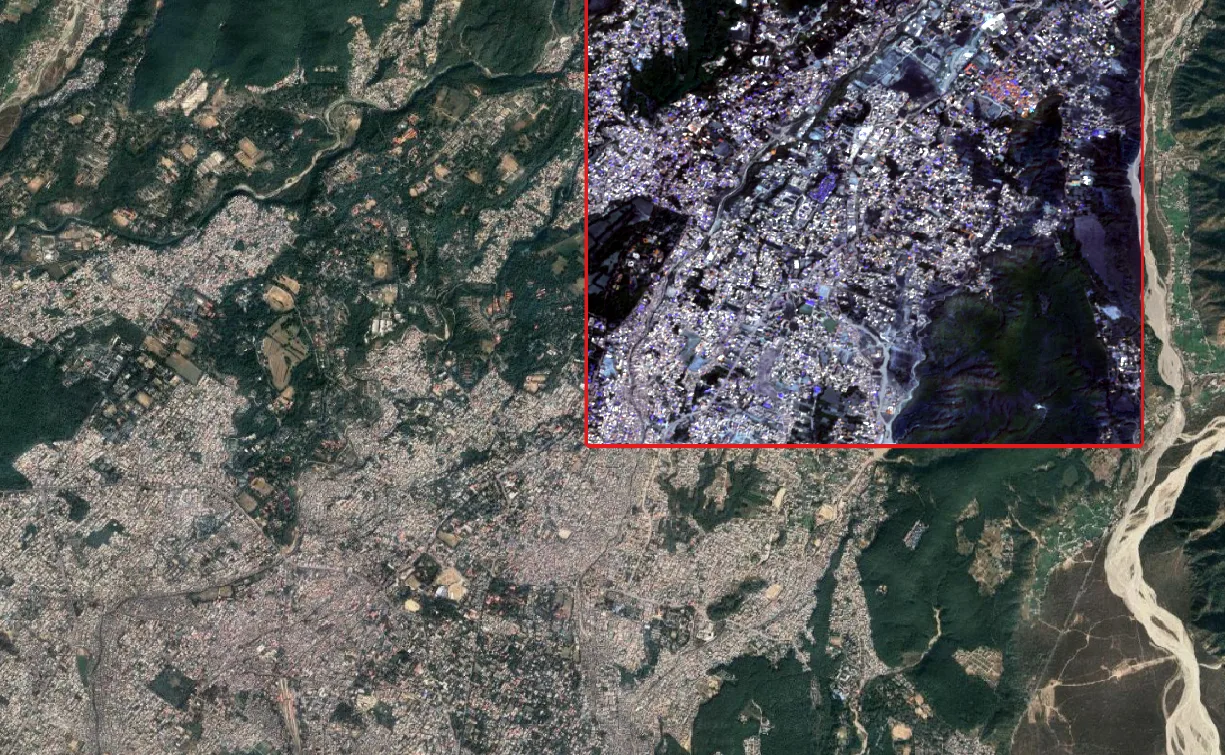
Urban Analytics
From mapping where the city has grown, to projecting where it is heading, to comparing growth scenarios.
- Where has the city grown?
- Where is the city growing?
- How should it grow?
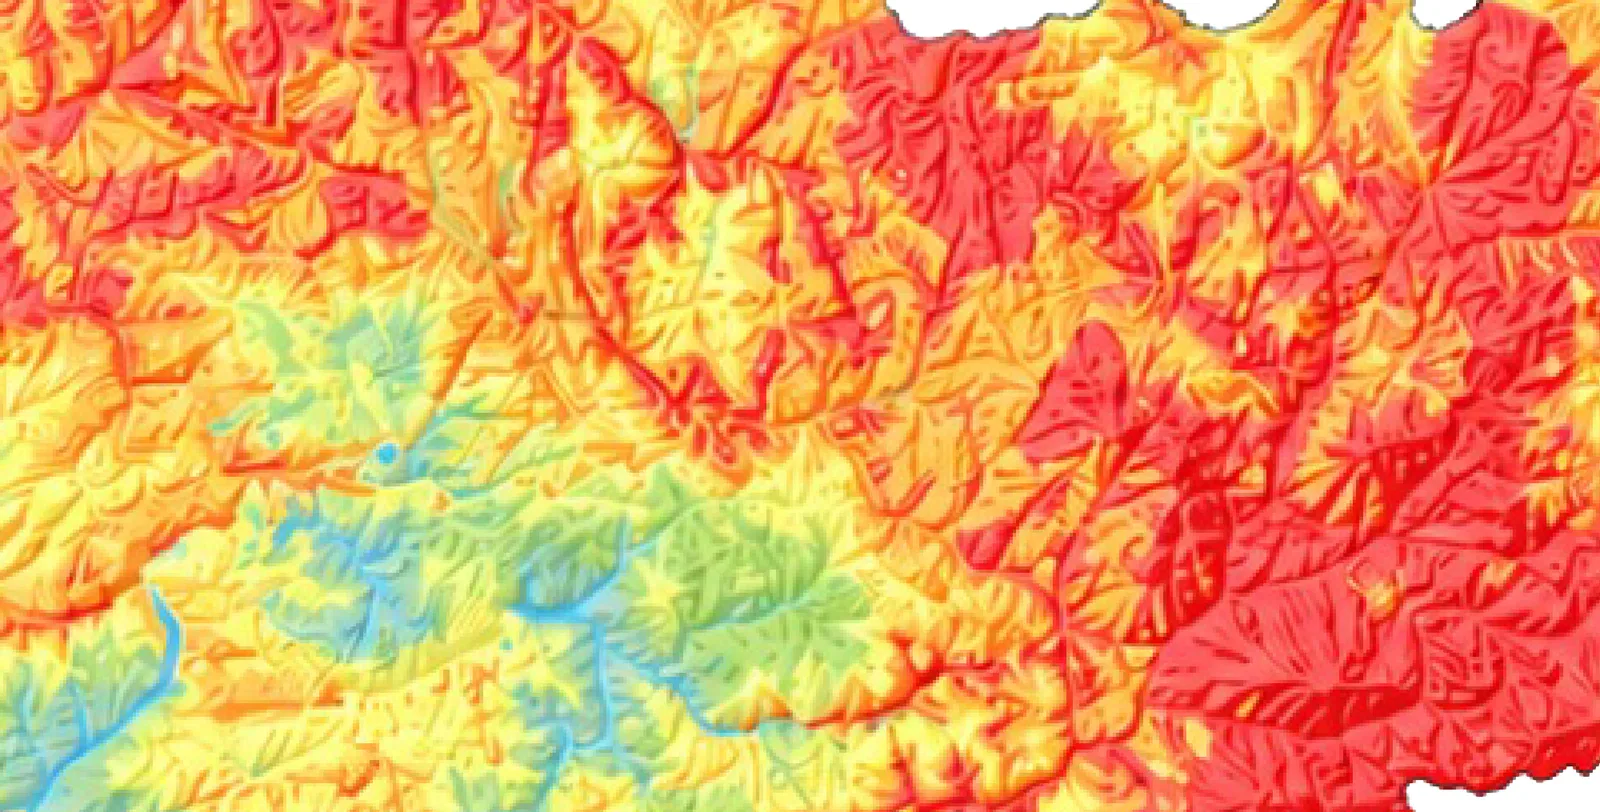
Natural hazard
From mapping where hazards strike, to modelling exposure and intervention scenarios, to ranking interventions.
- Where do hazards strike?
- Who & what is exposed?
- Restrict, mitigate, monitor?
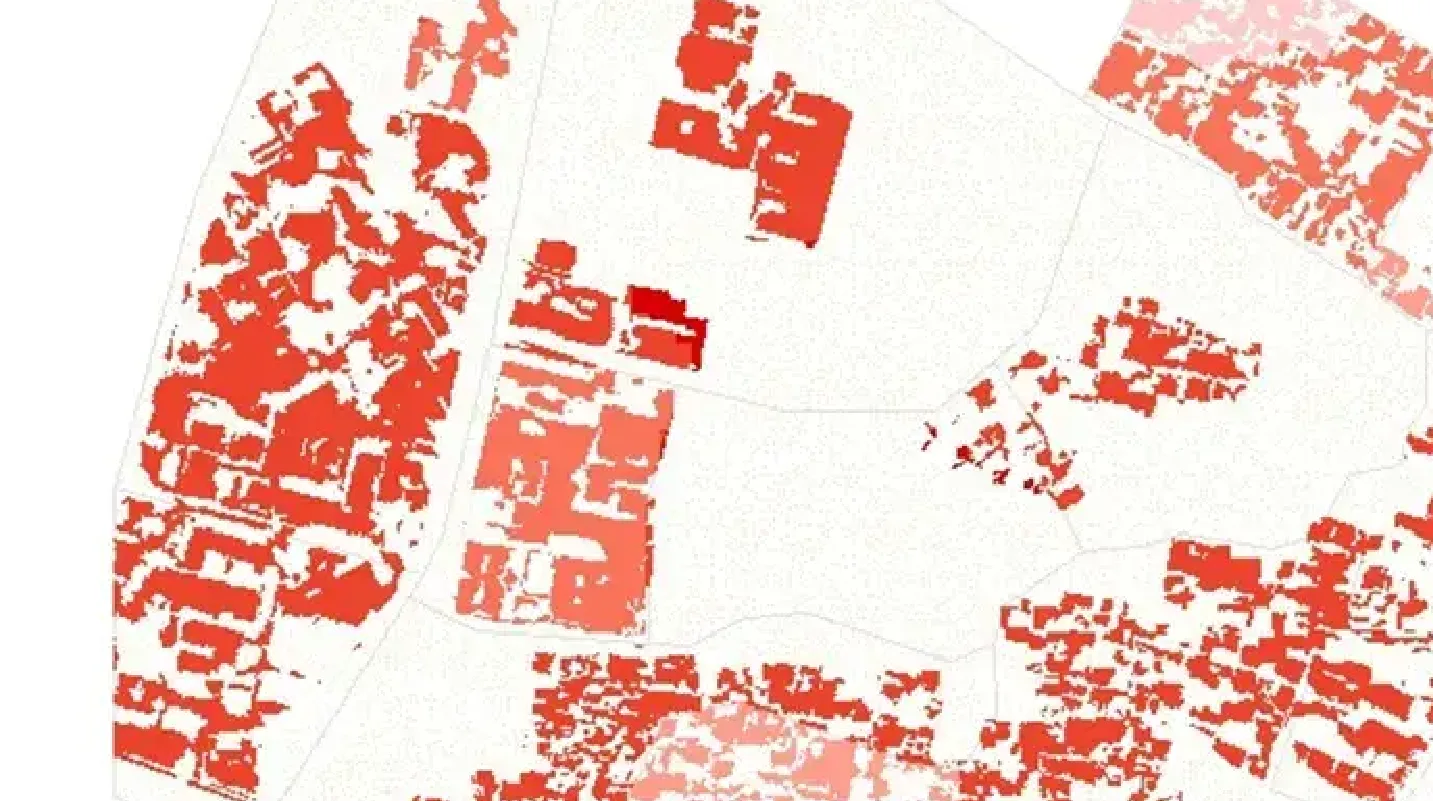
Stormwater & flooding
From mapping the drainage network, to simulating interventions, to ranking them by cost-benefit.
- What is there?
- What would happen?
- What should we do?
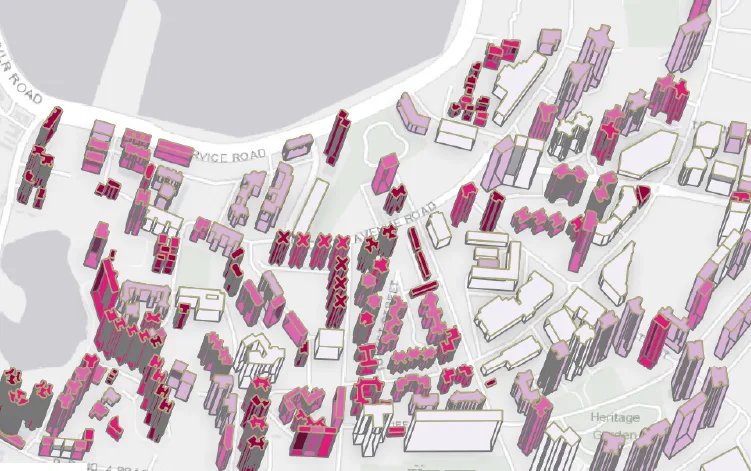
Urban heat & energy
From thermal mapping, to causal attribution, to ranked cooling programmes.
- Where is it hot?
- Why & what would help?
- Where to act first?
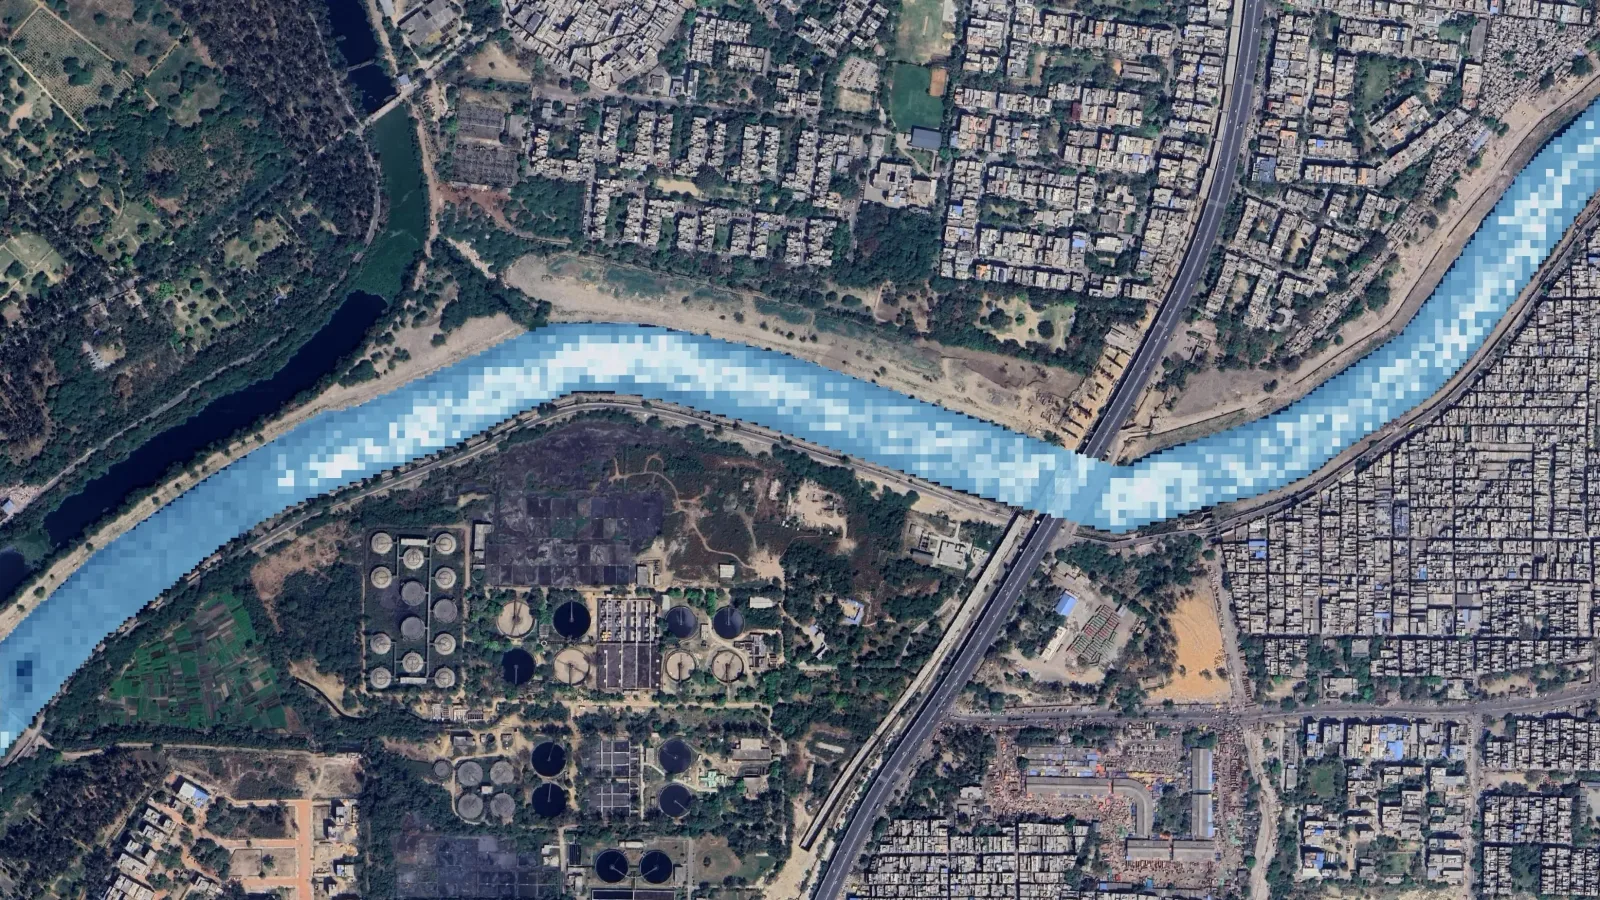
Water compliance
From observing where effluent enters water bodies, to modelling sources, to ranking enforcement.
- Where is the pollution?
- Where is it coming from?
- Where to enforce first?
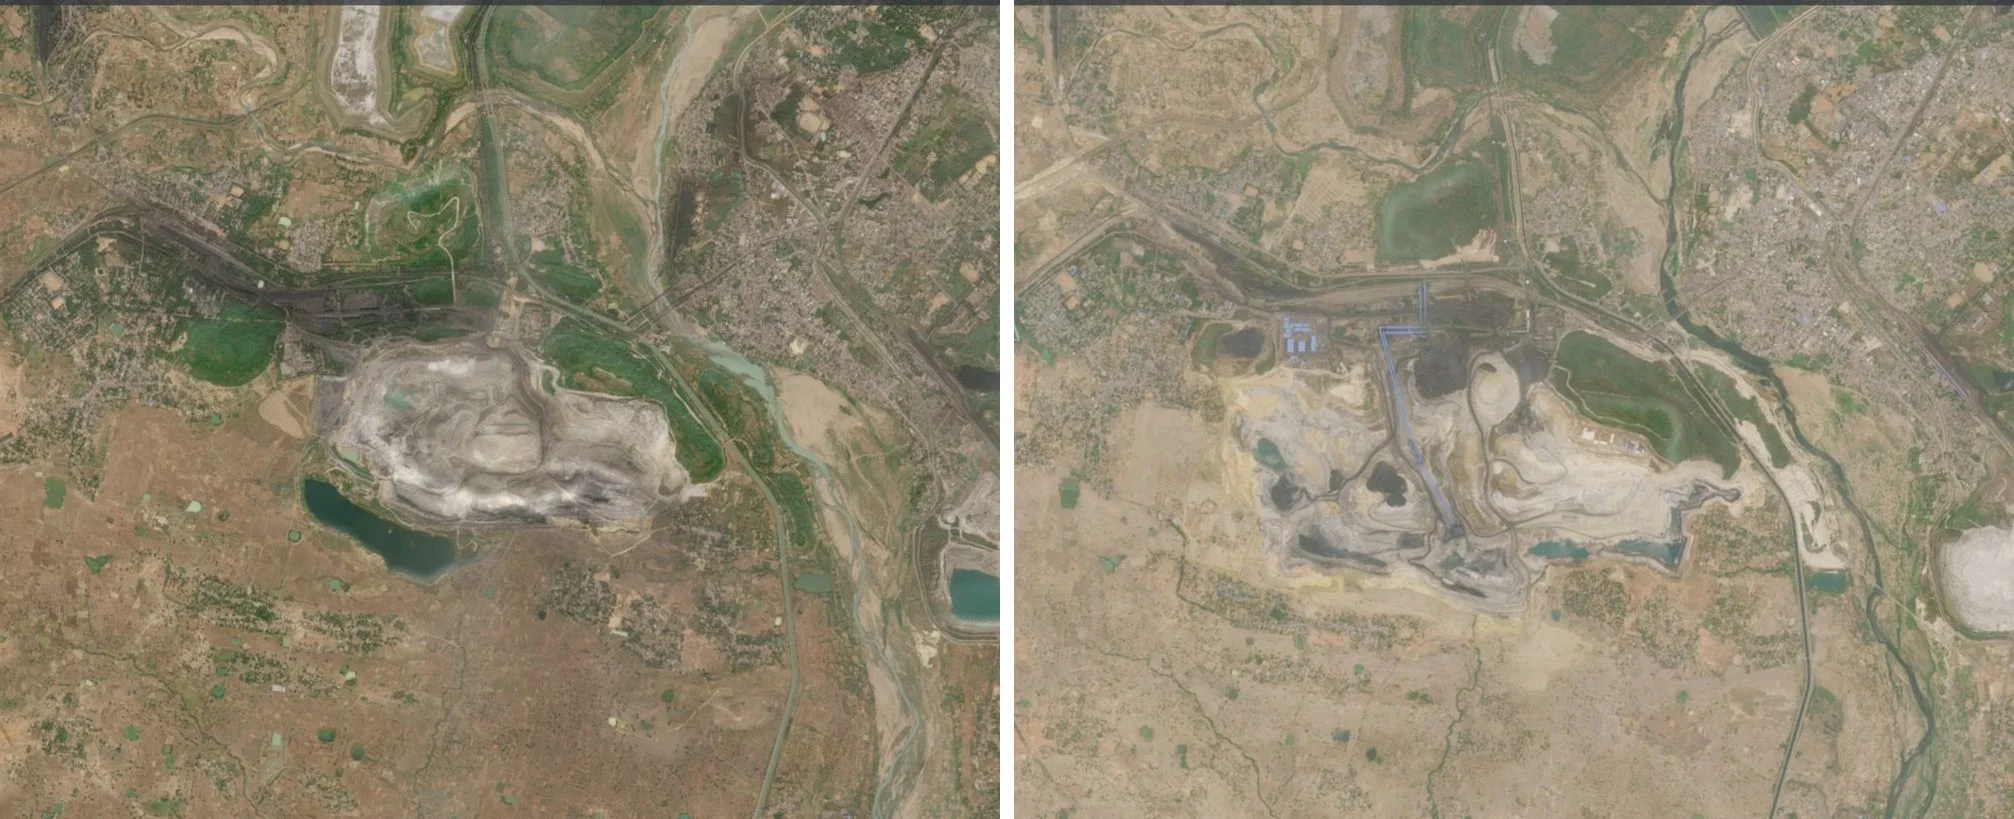
Independent site monitoring
Footprint, restoration, water and ground level, measured at the site and around it. Dated, mapped, and tracked against a fixed baseline, without operator involvement.
- What is on the ground?
- What has changed?
- Will it hold up?
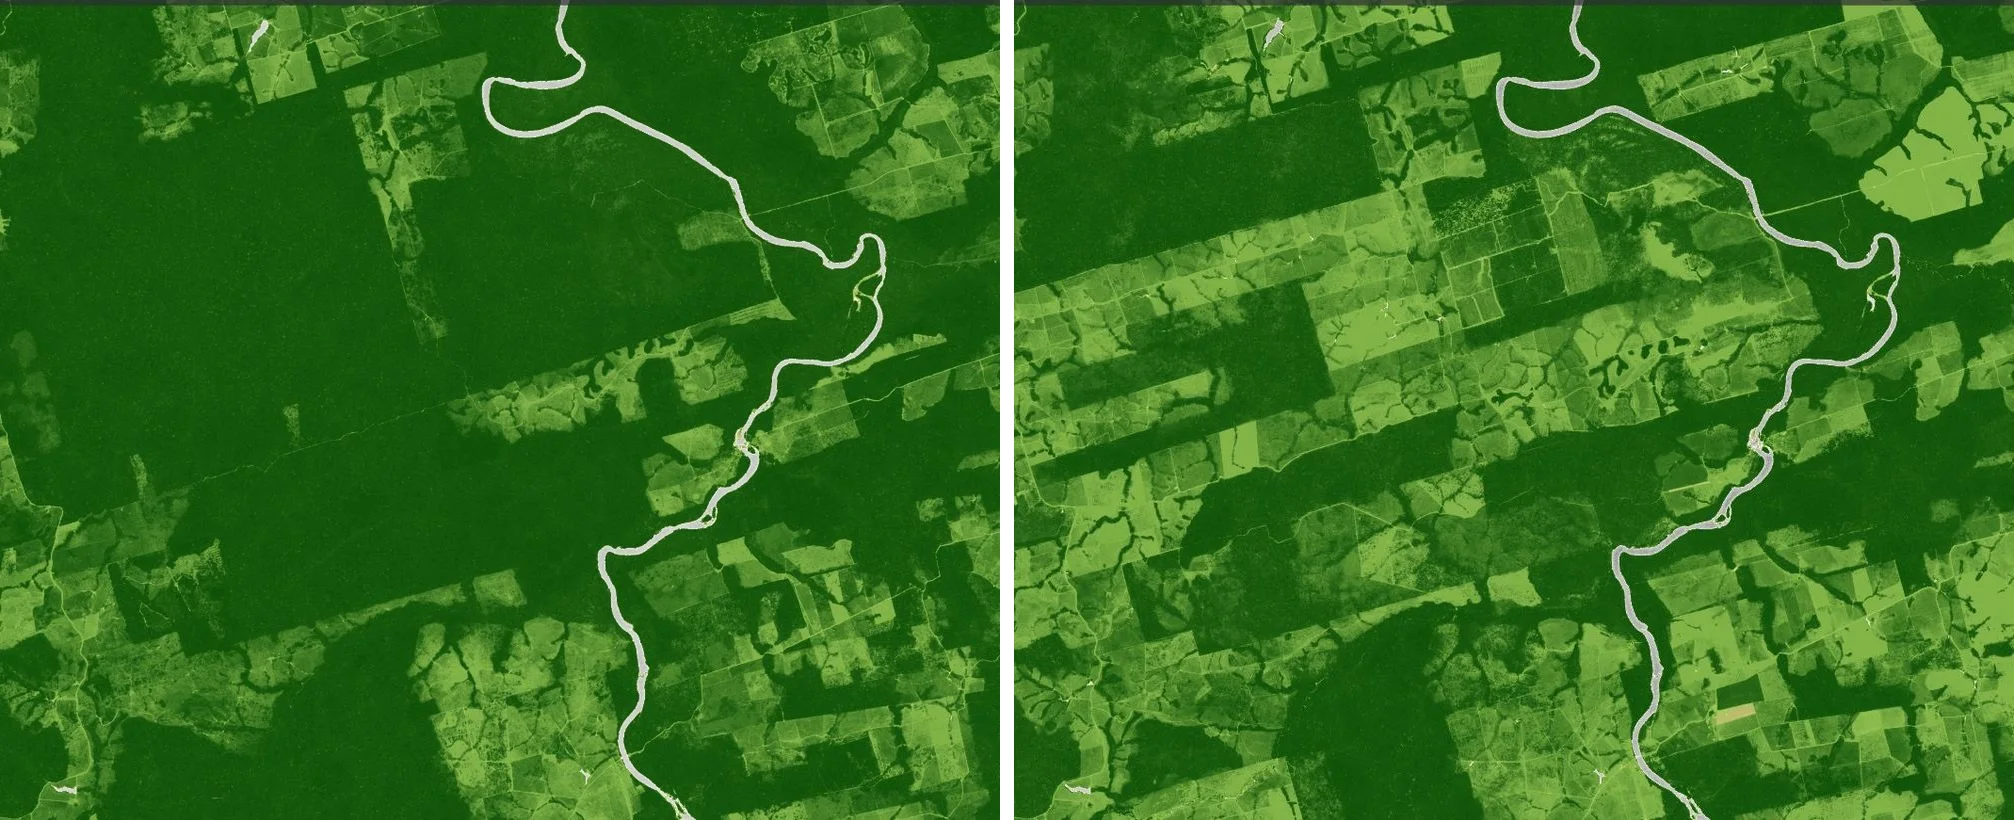
EUDR compliance data
From 30 December 2026, cocoa, coffee, rubber, soy, palm, timber and cattle placed on the EU market need compliant geolocation behind every Due Diligence Statement. The shipment paperwork is rarely the constraint. The plot data is.
- Can the plots be located?
- Is any of it exposed?
- Will it survive challenge?
Domain experts across remote sensing, hydrology, urban planning, geohazards and climate science.