
What we offer
Urban Analytics
Satellite-based mapping, modelling and monitoring for Urban Local Bodies. Land-use baselines, growth scenarios, heat island assessment, solar suitability and infrastructure planning.
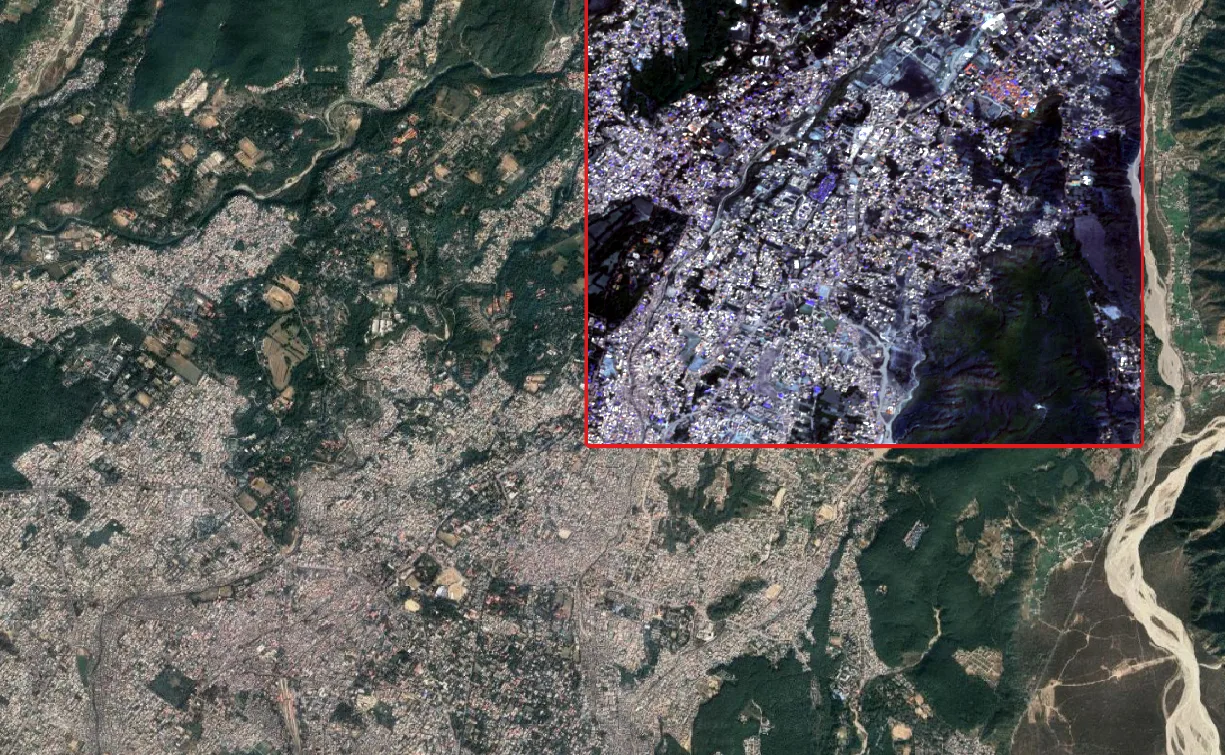
“Where has the city expanded over the last two decades?”
Change detection
Decadal land-use change record including pressure-boundary identification and sprawl mapping.
“Where is growth heading, and where will it conflict?”
Growth scenario modelling
Simulated urban growth to 2035 / 2040 under business-as-usual and policy variants; conflict mapping with constraints and intensity scores.
“Which growth scenario performs best, and at what cost?”
Strategic planning support
Ranked growth scenarios based on economical and ecological costs.
Where the city grew over two decades, where it is heading, and which growth scenario performs best.
Service overview
Urban Local Bodies are required to plan, invest and report against central scheme requirements, but most lack current spatial data on land use, infrastructure, environmental risk and growth. Decisions about where to build and what to protect are made without knowing what is on the ground, what has changed, and what is coming.
Anora Intel delivers a modular set of spatial products built from satellite data, ground validation and expert analysis. Every project produces a GIS dataset as its foundation, with reports, dashboards and scenario models on top, structured for reuse across departments and for updates over time.
Service modules
Urban growth scenario modelling
Safe urban expansion planningProjects expansion to 2030 and 2040, identifies growth corridors that avoid flood, landslide and ecological risk, and estimates the infrastructure demand they will generate.
Urban heat island assessment and solutions
Climate-resilient urban designThermal satellite data maps surface temperature and finds heat-stressed neighbourhoods. Interventions are modelled before they are built: the projected cooling from green roofs on a specific set of buildings, for example.
Solar suitability mapping
Renewable energy site selectionBuilding-level rooftop solar potential from roof geometry, shading, material and orientation. Shows which buildings pay back and which are overshadowed.
Green space and vegetation monitoring
Environmental impact assessmentGreen cover distribution, health and change over time. For urban forestry planning, park prioritisation and biodiversity corridors.
Utility and infrastructure mapping
GIS-based planning submissionsSatellite data combined with ground survey and municipal records into GIS-ready utility network maps. Recent records shrink the survey requirement.
Applications
Evidence base for master planning
GIS-integrated master plans under AMRUT 2.0 and PM GatiShakti depend on current, verified spatial datasets. We deliver the data and the scheme-aligned documentation.
Safe development siting
Growth scenarios show where new townships and infrastructure can be developed safely, keeping investment out of flood plains, landslide corridors and ecologically sensitive zones.
Development conditioning
Site-specific conditions for development approval: green roofs required in identified heat island zones, construction restricted in high flood-risk areas.
Intervention effectiveness monitoring
Before-and-after satellite monitoring shows whether interventions, from green roofs to drainage upgrades, had the expected effect on temperature, runoff or vegetation.
Reusable datasets across departments
One spatial analysis serves multiple departments and reporting cycles: a land-use map made for planning can also feed Smart Cities Mission dashboards and AMRUT 2.0 documentation.