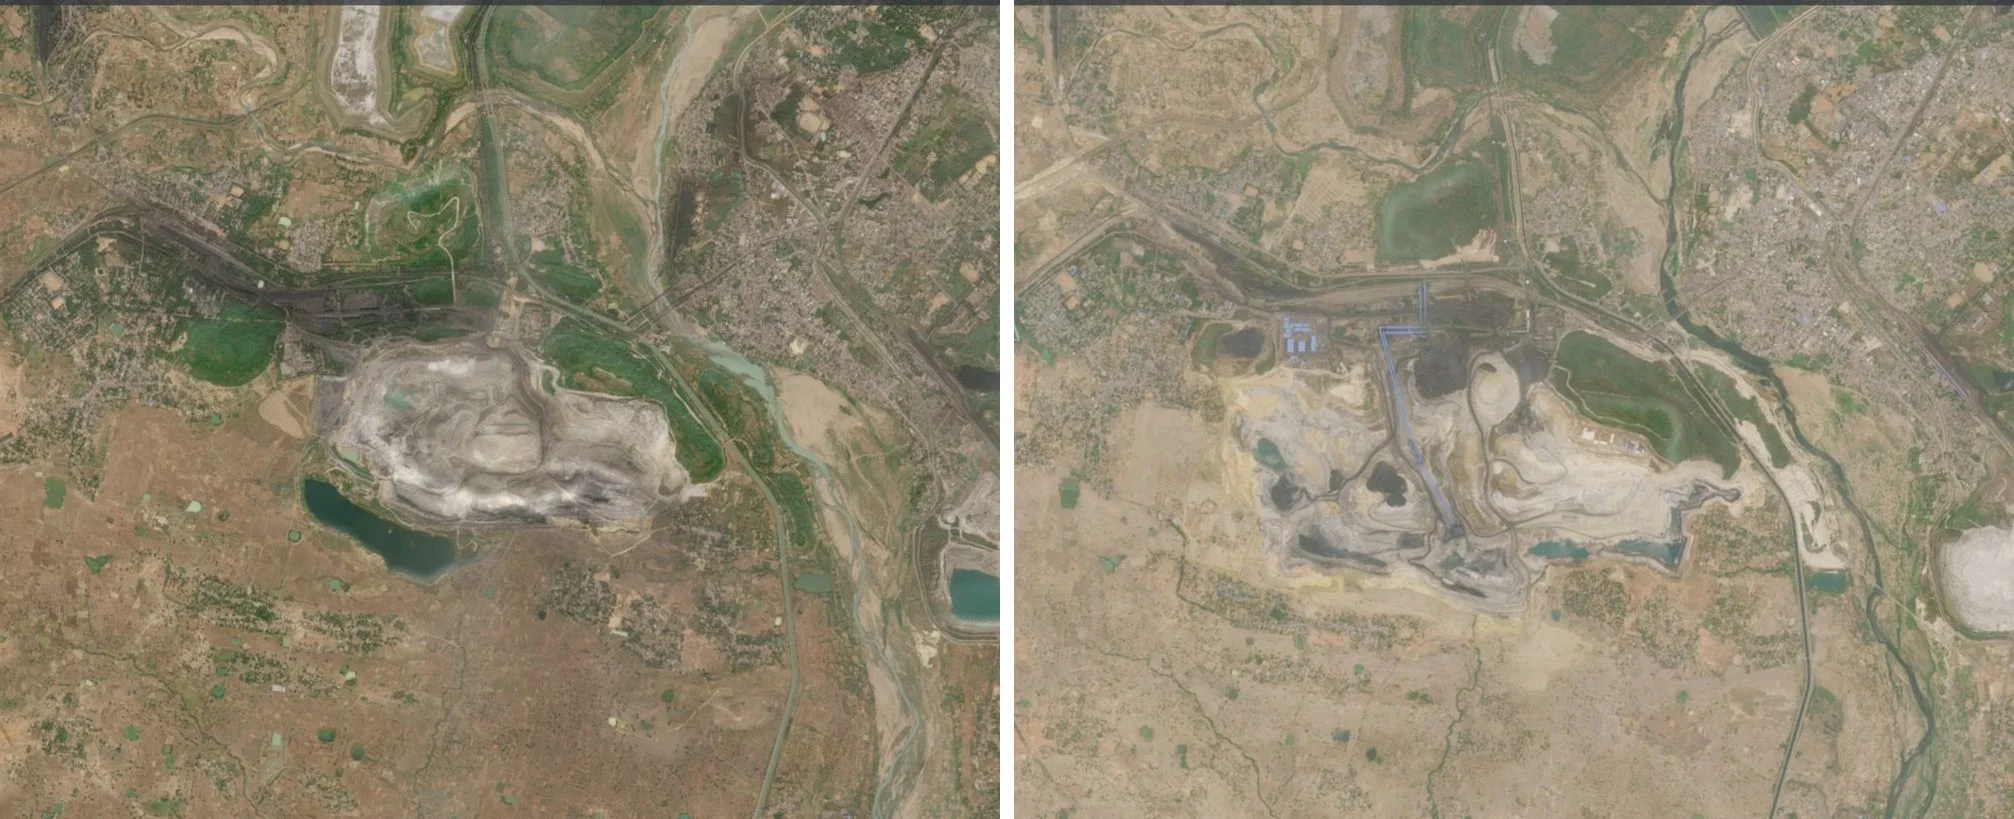
Satellite Monitoring & Environmental Verification for Mines
Independent oversight of a mine's changing footprint, whether the ground is settling, and if environmental commitments are being kept.
Introduction
Hundreds of mines can be tracked automatically from orbit: how much each has grown in terms of area and excavated volume, how the ground in and around the mine is moving, and whether environmental commitments in terms of land use, water impact and restoration are being kept. Anora Intel specialises in integrating satellite data into decision making, with analysts trained at IIT Bombay. This note explains what we can do, and what a first, free look from orbit can tell.
What we do
For any surface mine, and the land around them, we can monitor:
- Footprint and area, traced year on year
- Automated checks against a (leased) land boundary
- Excavated volume estimates
- Ground subsidence and deformation
- Reclamation, vegetation, water and land-use verification against the site’s environmental commitments
Every output is dated and mapped, and produced independently, without operator involvement.
What free data already delivers
Before any imagery is bought, open satellite data already covers most of what is required.
This matters most for area and boundary work. Checking one mine at survey-grade resolution is straightforward. Checking an unlimited number of mines automatically, every year, is costly if it means buying high-resolution imagery for each one. Free data removes that cost, so screening can run continuously across as many sites as needed. Paid, higher-resolution imagery is then reserved for the cases free data flags, where survey-grade evidence is actually required.
Footprint & area
Footprint and area start with an initial assessment based on spectral indices, then track change automatically year on year.
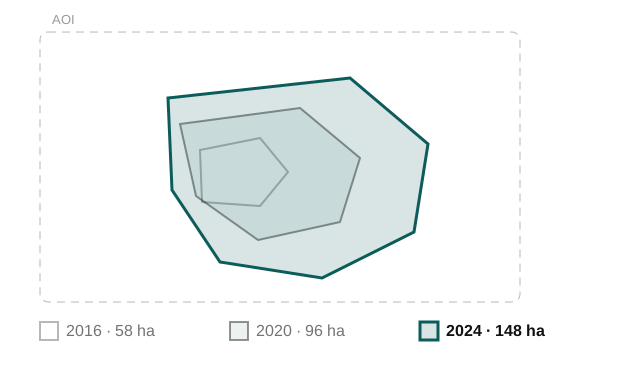
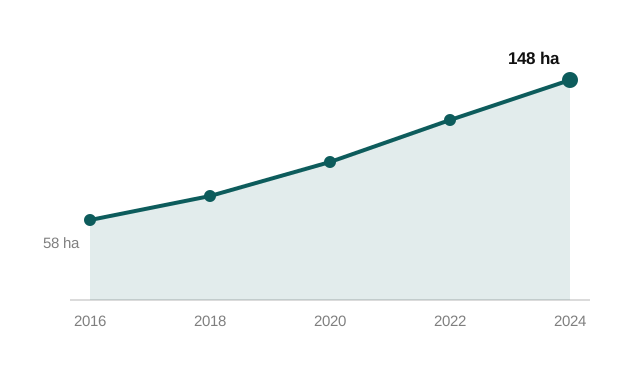
Boundaries from free data are accurate to about ten metres. The area figure depends on thresholds we tune once and freeze across every year, so the trend is real even if the absolute number carries some uncertainty. This is fine for screening, not survey-grade.
Excavated volume
Differencing two free elevation models (a 2000 SRTM surface against the more recent Copernicus GLO-30 surface) gives a single, coarse estimate of material removed over that window. It is not a per-year series, and it is not survey-grade, but it is real, it is free, and for a site that has expanded substantially since 2000, it gives an indication of volume removed.
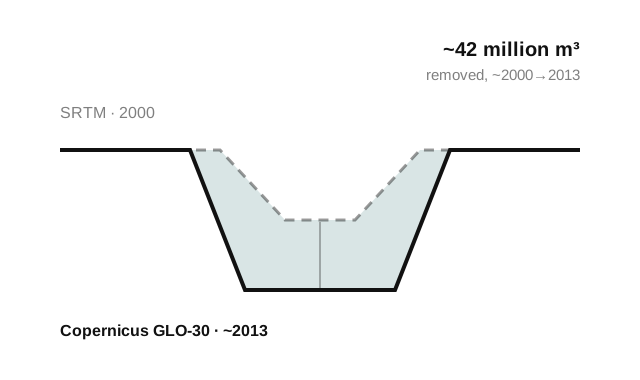
This free volume measure is more reliable as a comparison than as a single absolute number: consistent across sites, useful for judging scale, but not a precise absolute value for any one site on its own.
Ground deformation
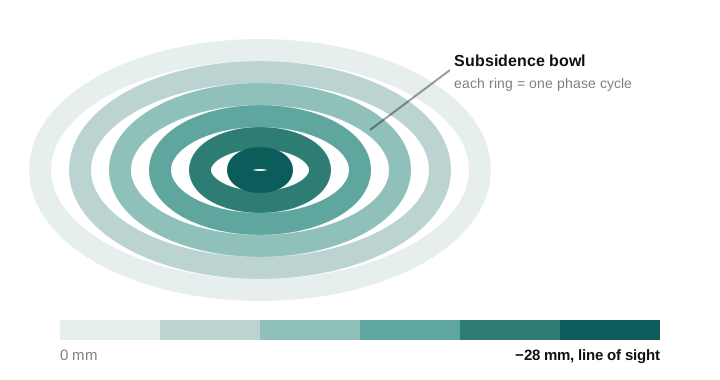
Two Sentinel-1 radar images of the same ground, taken weeks apart, can show millimetres of movement that no camera would catch. A concentrated subsidence bowl usually points to active underground workings or a dump that hasn’t finished settling, and catching it early matters: undetected ground movement is a safety risk to workers and nearby infrastructure before it is a compliance one, and is often required evidence for mine-closure sign-off.
Automated encroachment
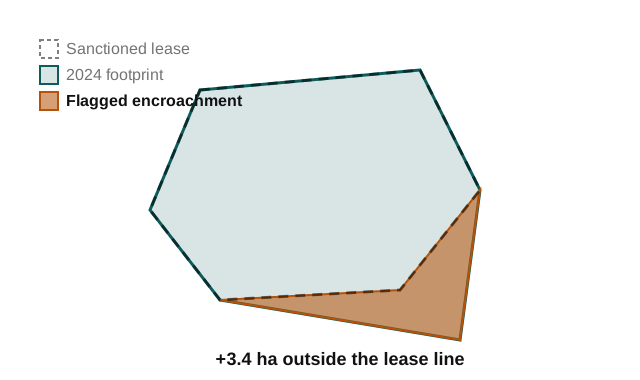
Once a site’s footprint is traced, checking it against a land boundary, such as the sanctioned lease, is just a geometry comparison, run automatically every year instead of checked by eye. Any part of the footprint outside the lease gets flagged with its own area figure.
Independent environmental verification
A mining operation carries environmental obligations that need third-party evidence: clearance conditions, reclamation and green-belt commitments, and, for larger listed companies, SEBI’s BRSR Core, which makes that assurance mandatory rather than optional. What we, as a third party, cover:
- Land use and vegetation change: how the lease, its surroundings and nearby forest cover have shifted over time.
- Reclamation and dump greening: area re-vegetated each year on reclaimed land and overburden dumps, checked against the approved plan.
- Water-body monitoring: extent and change of pit water, ponds and nearby water bodies, with indicative turbidity signals.
- Ground stability: subsidence and settlement patterns relevant to safety and to mine-closure obligations.
All of this is dated, mapped, independent of the operator, and can be tied directly to a site’s clearance conditions and to the relevant BRSR Core disclosures.
How accuracy grows with paid data
When a site or a decision calls for it, the same methods run on sharper imagery and the accuracy goes up.
| Tier | Data | What it adds | Boundary accuracy | Volume accuracy |
|---|---|---|---|---|
| Free (screening) | Sentinel-2 / Sentinel-1 / SRTM | Area trends, change history, subsidence | About ±10 m, roughly one pixel | Rough as an absolute figure; more reliable as a comparison across sites |
| Mid (sharper) | PlanetScope; ISRO Cartosat | Crisper edges, higher revisit, Indian-sovereign data | ±3 m (Planet) or ±1 m (Cartosat) | Better; roughly within 20–30% |
| Premium (evidence) | Pléiades / WorldView, with stereo | Survey-grade, audit-ready detail on a chosen site | ±0.3–0.5 m | Per-year, within about 5% |
The demonstration we propose
We can put together a demonstration built on free data, on one or two of your own sites. It would show each mine’s boundary traced year by year, with area growth charted and checked automatically against the sanctioned lease. It costs nothing and doesn’t take long to prepare.
We’d be happy to walk you through it in person.


Outcome-based geospatial services for environmental oversight and decision support
Anora Intel specializes in satellite data analysis for governments and corporates, supporting urban development, environmental reporting and supply chain due diligence. Every output is independent, grounded in field validation, and delivered across India and Europe.
Get in touch