
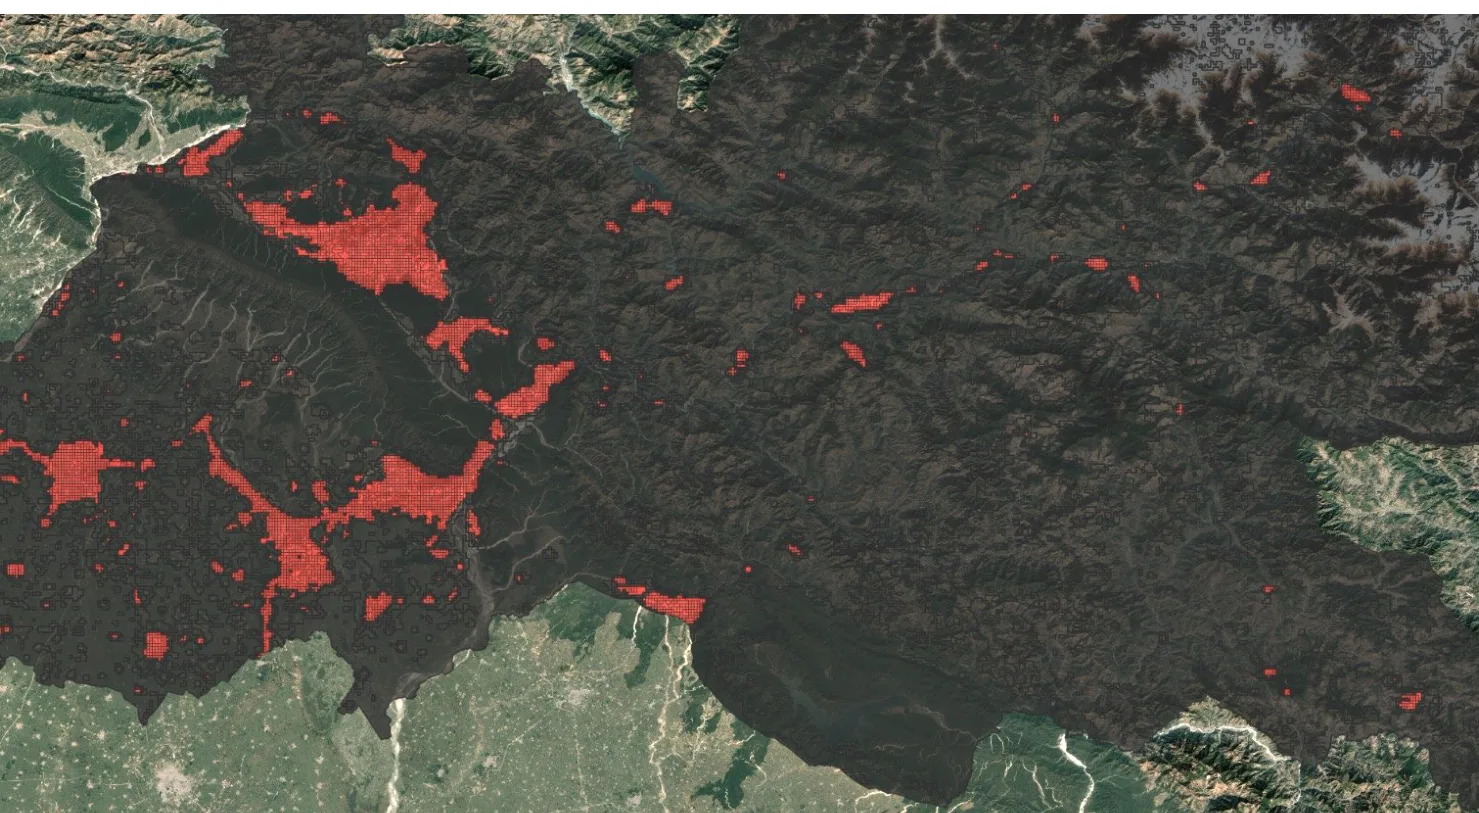
Spatial intelligence for decision-makers
Simulate hazards, model growth, monitor change. Scoped to the schemes a department already reports against, and delivered to its decision cycle.
Night-time lights, Uttarakhand 2025
What we doDecision support
We help governments sharpen plans before launch and monitor them as they run, beside your engineers and regulators, never in their place.
Integrate satellite data + analysis
Satellites pass over the same ground again and again. Cheap, frequent, and needing no new field teams.
Fast, internal, shaped to you
We deliver to your decision cycle. Results stay internal, in the format your team already uses: brief, GIS layer, dashboard or API.
Three service areas, five worked examples
Each example runs through the same three levels. What changes between them is the subject, not the method.
Cities & infrastructure
Where cities grow, heat, flood and fail. Mapped, modelled and prioritised.
- Urban analytics
- Sprawl developments
- Urban heat & energy
- Stormwater & drainage
- Natural hazard risk
- Post-event damage
Compliance
An independent check that scales, working next to your on-site systems and inspections.
- Wastewater monitoring
- Surface-water quality
- Benchmarking & prioritisation
Ecosystem pressure
Confirming what's happening on the ground, and what isn't.
- Vegetation & green space
- Land-use compliance
- Enforcement & incentive support
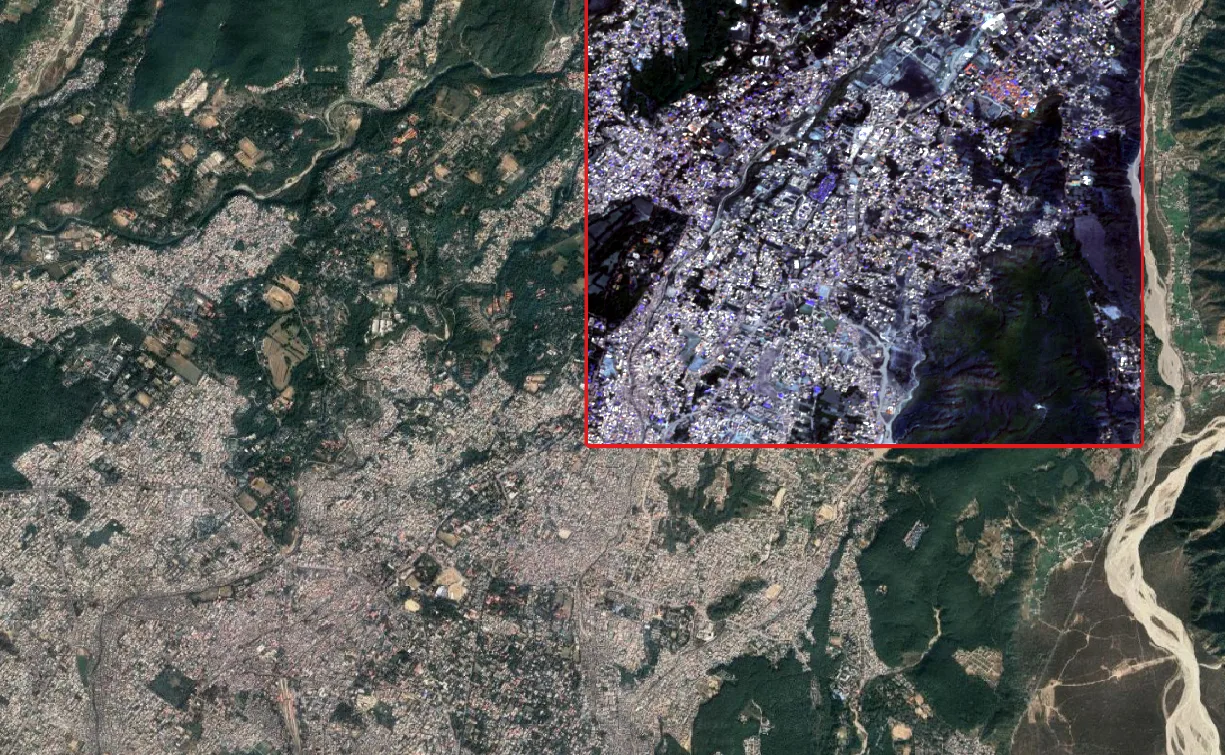
Urban Analytics
- Where has the city grown?
- Where is the city growing?
- How should it grow?
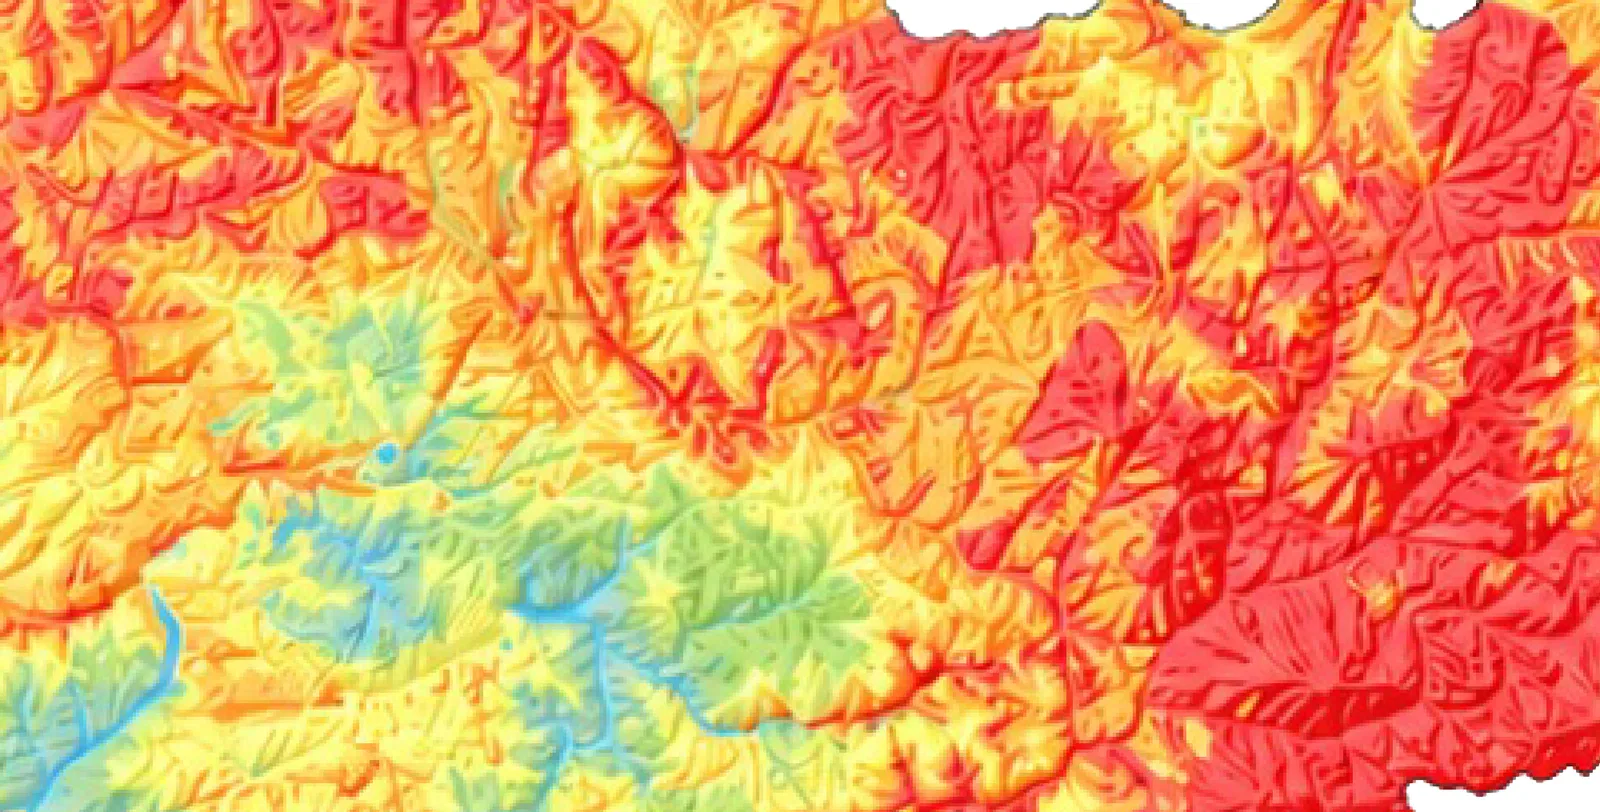
Natural hazard
- Where do hazards strike?
- Who & what is exposed?
- Restrict, mitigate, monitor?
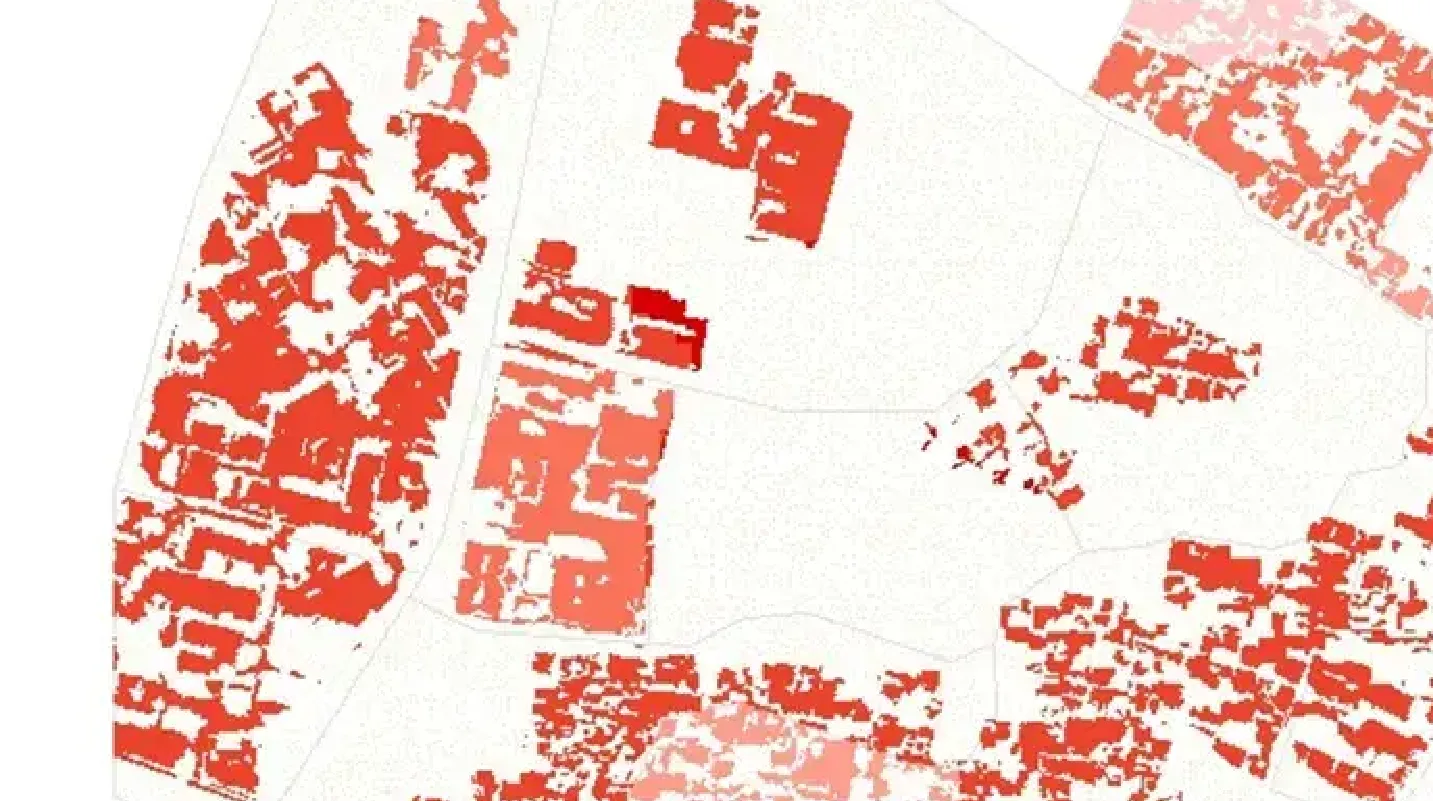
Stormwater & flooding
- What is there?
- What would happen?
- What should we do?
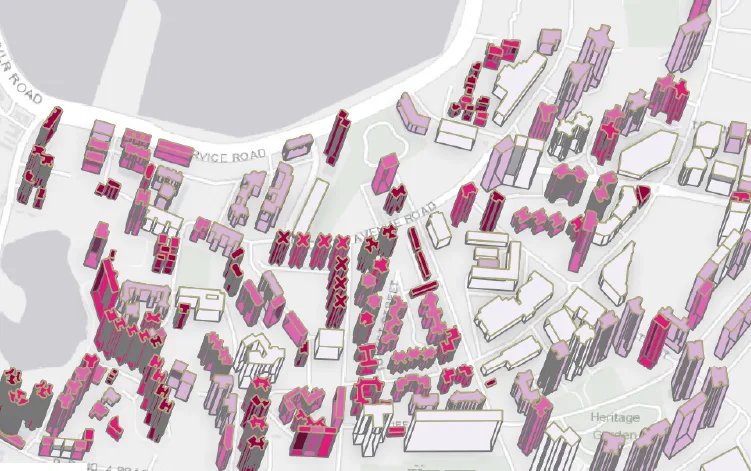
Urban heat & energy
- Where is it hot?
- Why & what would help?
- Where to act first?
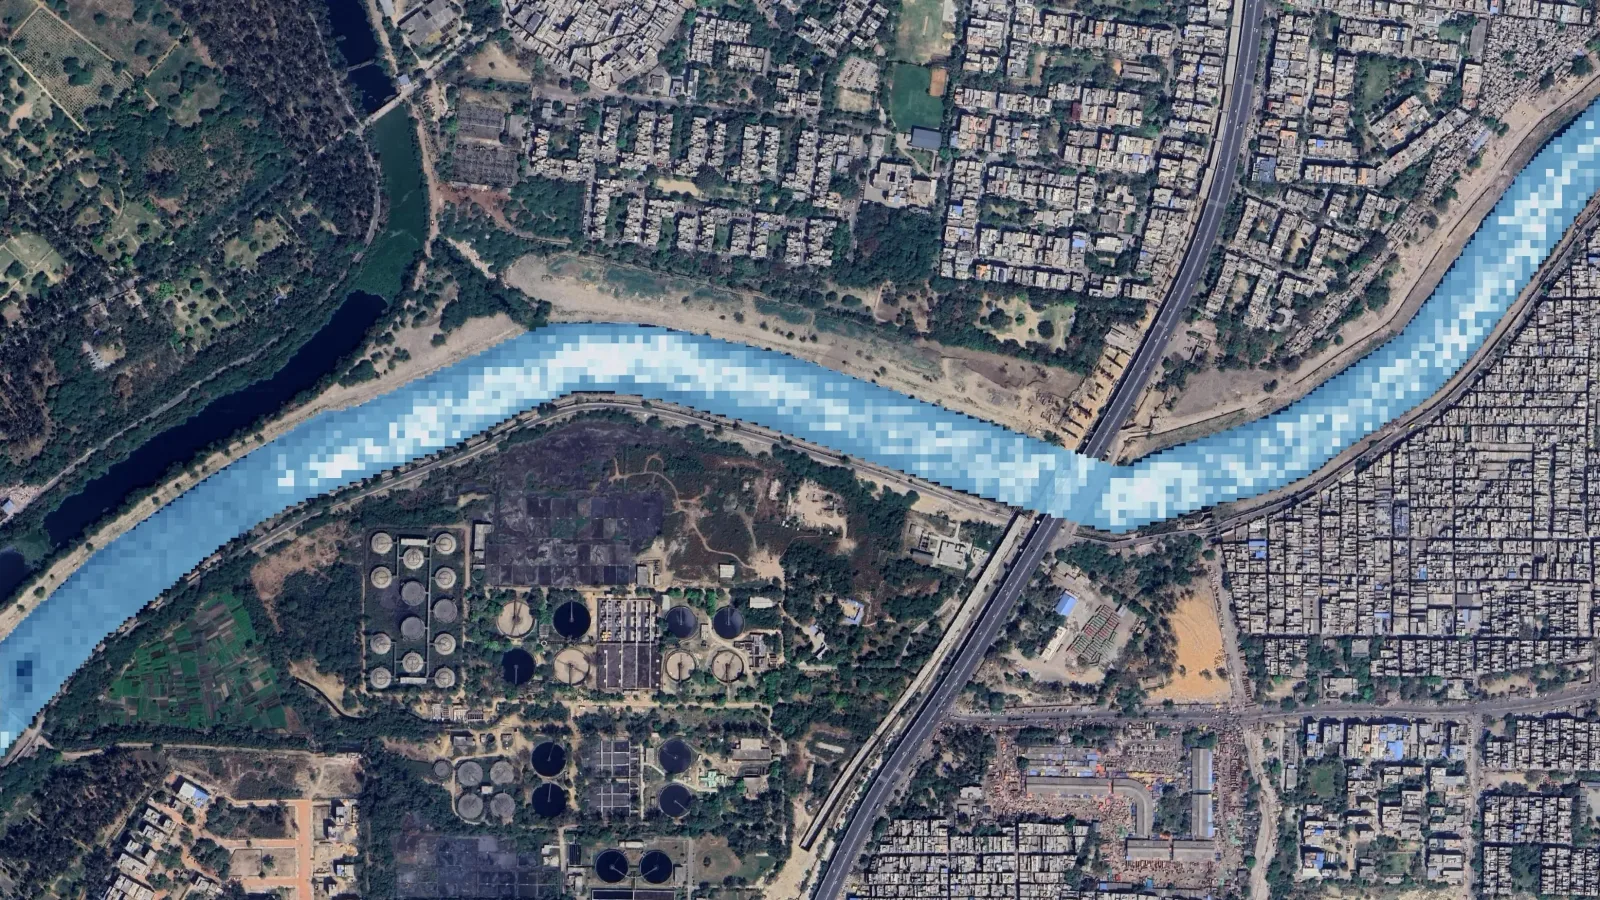
Water compliance
- Where is the pollution?
- Where is it coming from?
- Where to enforce first?
Three levels, and where an engagement starts
An engagement enters at whatever level the existing data supports, and stops at whatever level the decision requires. A department with a usable baseline starts at modelling. A department that only needs to know what is there does not need the other two.
Surveying & mapping
We map the baseline: drainage networks, hazard zones, land cover, urban footprint. Checked end to end, so every team plans from the same map.
Modelling & simulation
We run that baseline forward: monsoon stress, growth, the effect of each fix.
Decision support
We rank and price the options: best return per rupee, where to start, how to phase it across the budget.
- Satellite imagery
- Terrain / DEM
- Built-up & roads
- Rainfall / IDF
- Drainage & soil
- Population
- Intervention cost
- Asset value
- Budget lines
Each level adds the layers the next decision needs: the baseline first, then what drives change, then cost and value. Which is why the last question on this page is which of the three describes your department today.
Today's decision-maker pieces a picture together from five sources
- 01 Government data accurate, but slow to update
- 02 Field sensors accurate, but expensive and only where deployed
- 03 District reports could benefit from increased depth
- 04 Academic research rigorous, but slow and limitedly translated to application
- 05 Institutes strong on warning systems, weaker on day-to-day decisions
A sixth layer
A repeat satellite view, laid over the five sources you already use and pulled into one picture. We analyse, model, simulate and support your decisions in the most technologically advanced way.
You already piece a picture together from five sources. We add a sixth that refreshes every cycle, and pull them into one.
A PDF you look at. A GIS layer you can use.
Looks right, does little
A printed or PDF map shows one view, once. It cannot be stacked, queried, measured or updated. Every new question means a new map, from scratch.
Saved once, in a standard any system can read
Every map will be a coordinate-locked layer in an open format which is the same standard of PM GatiShakti, NSDI and the National Geospatial Policy 2022.
Every department draws from the same source
Saved that way, a layer lives once, stacks with every other layer, exports for analysis, and plugs into the national system, instead of ten departments keeping ten incompatible copies.
Save every map as a geo-referenced, standard layer so it can be stacked, measured, analysed and exported. That standard is the basis of PM GatiShakti and NSDI.
Twelve maps we can create, by civic theme
What each map is built from, and what it lets you decide.
- Water
- Safety
- Growth
- Heat
- Nature
- Water quality
Frontier methods, applied by the researchers themselves







Aligned with AMRUT 2.0, PM GatiShakti, Swachh Bharat, Namami Gange, Smart Cities Mission and NDMA guidelines. An Indian entity, built for Indian procurement.
Where would you say your department sits today?
We start where you are. Tell us which of the three describes your position and we will send back a scoped outline, by email, within five working days. No call unless you ask for one.
We need the baseline mapped.
Request a proposalWe have the data, we need the model.
Request a proposalWe have the model, we need the prioritisation.
Request a proposalWould rather talk it through first? Book a 30-minute call.
The layers you build are already funded
Which central scheme funds which layer, and where a GIS-ready map sits inside an existing budget line.
Your data, handled to government standard
Who owns the layers, where data is stored, what can and cannot be mapped, and the standards we operate to.